Case 05 · Amazon Robotics · ToteASRS Operational Research

Mapping the operations tool ecosystem across an Amazon FC.

Before Amazon Robotics could design new tools, we needed a ground truth of how an entire fulfillment center actually runs.

Wide research photo from a fulfillment center — operators at their dashboards

Role

UX Lead — co-led with partner UX

Team

Product, ToteASRS, UX

Timeline

March 2023

A building with many operators, hundreds of metrics

Hundreds of metrics are monitored constantly by different users across different tools and dashboards. The challenge was mapping all of it before designing anything new.

Scale

An average Amazon Robotics fulfillment center has ~1,300 direct-labor associates and 160 operations leaders and support staff, working two shifts a day across four periods each.

Roles

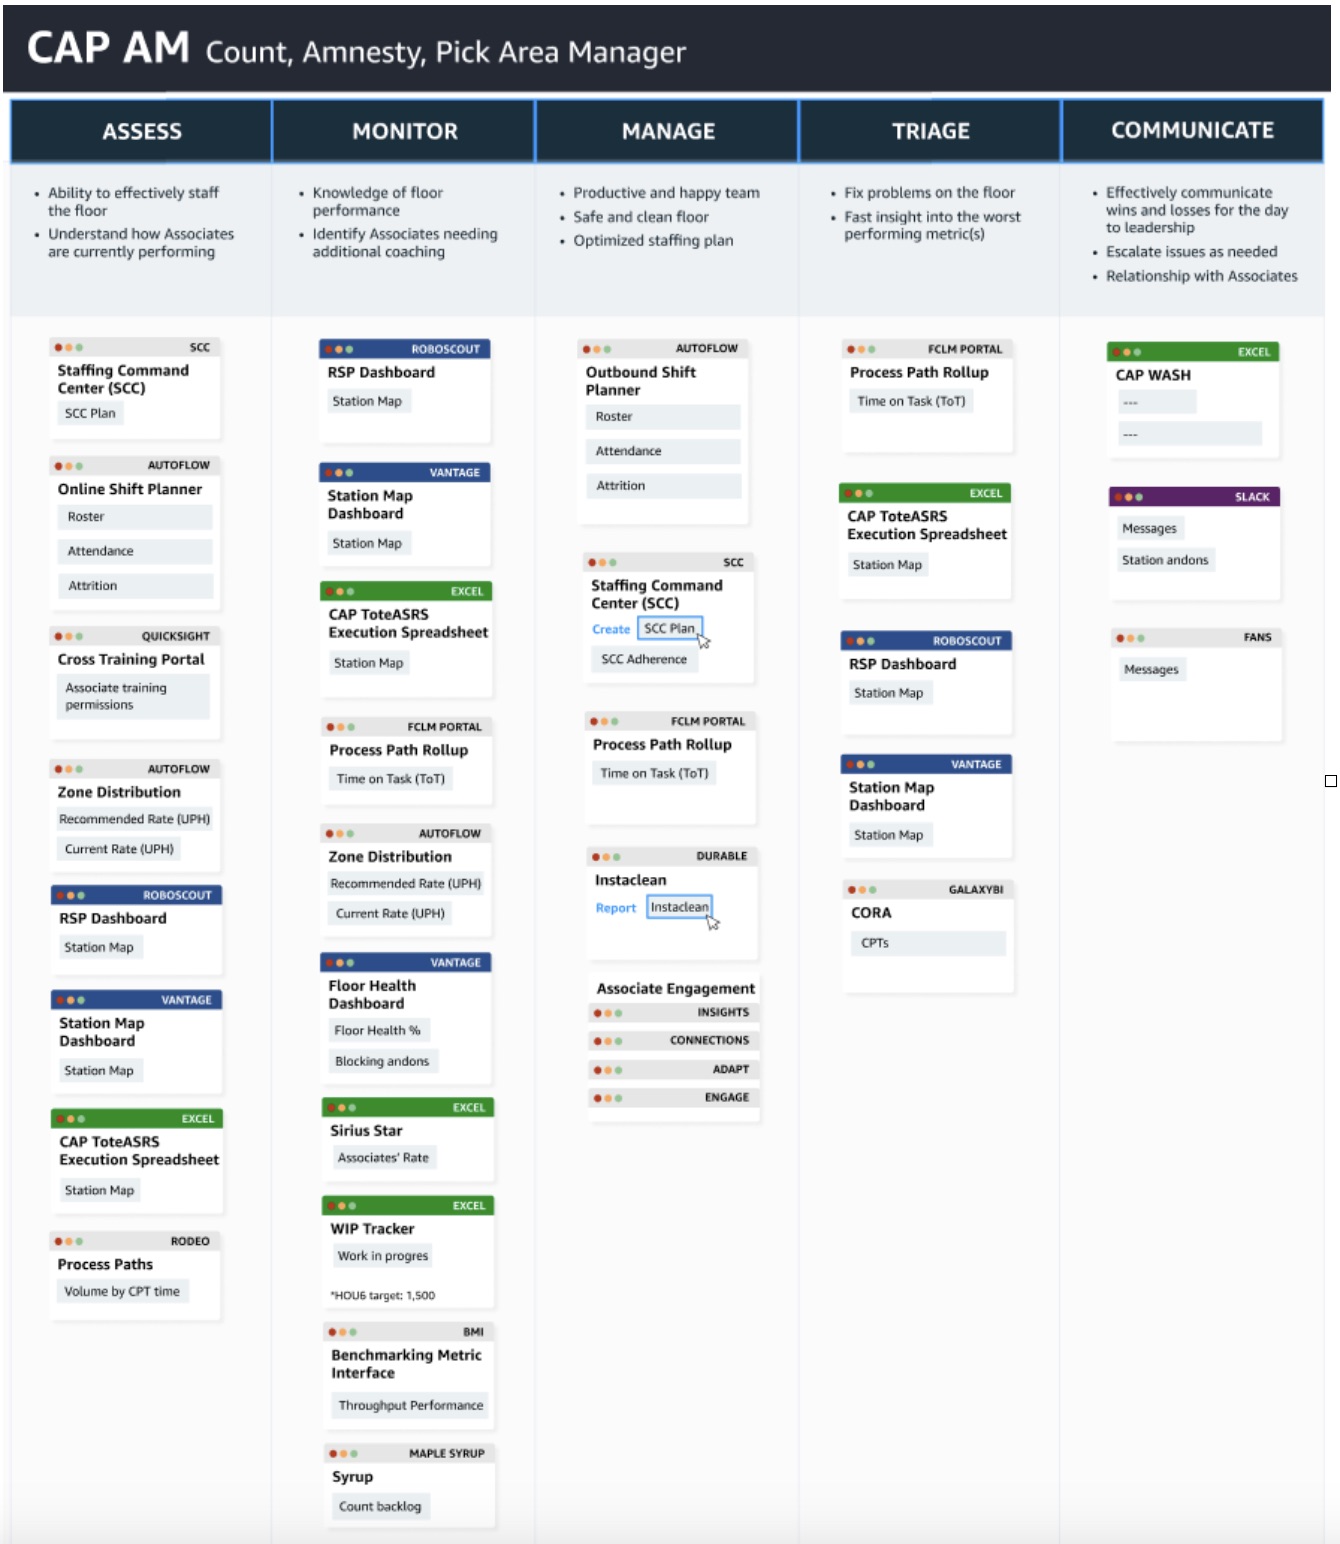
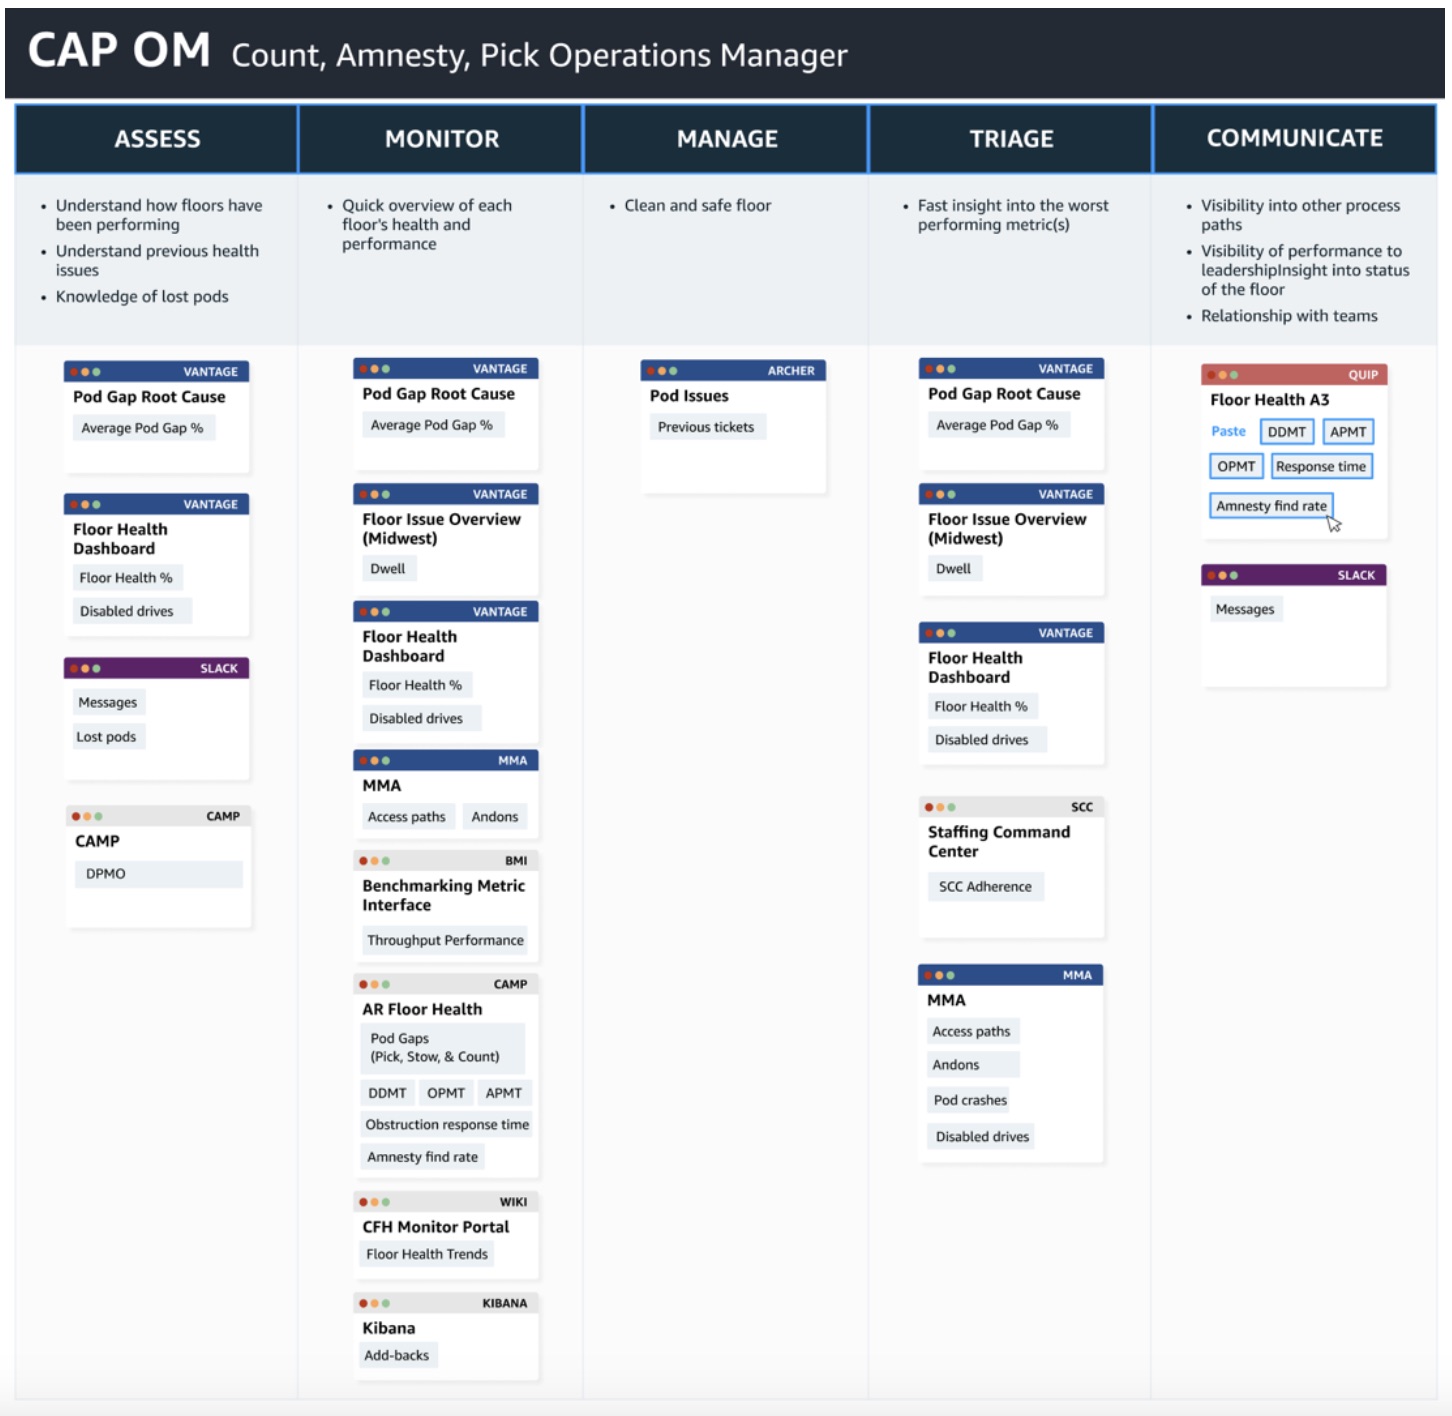
Five organizational levels — GM, Sr. OM, OM, Area Manager, and PA (Process Assistant) / QB (Quarterback) / AFM (Amnesty Floor Monitor) — each with different tools, metrics, and decision rhythms.

Friction

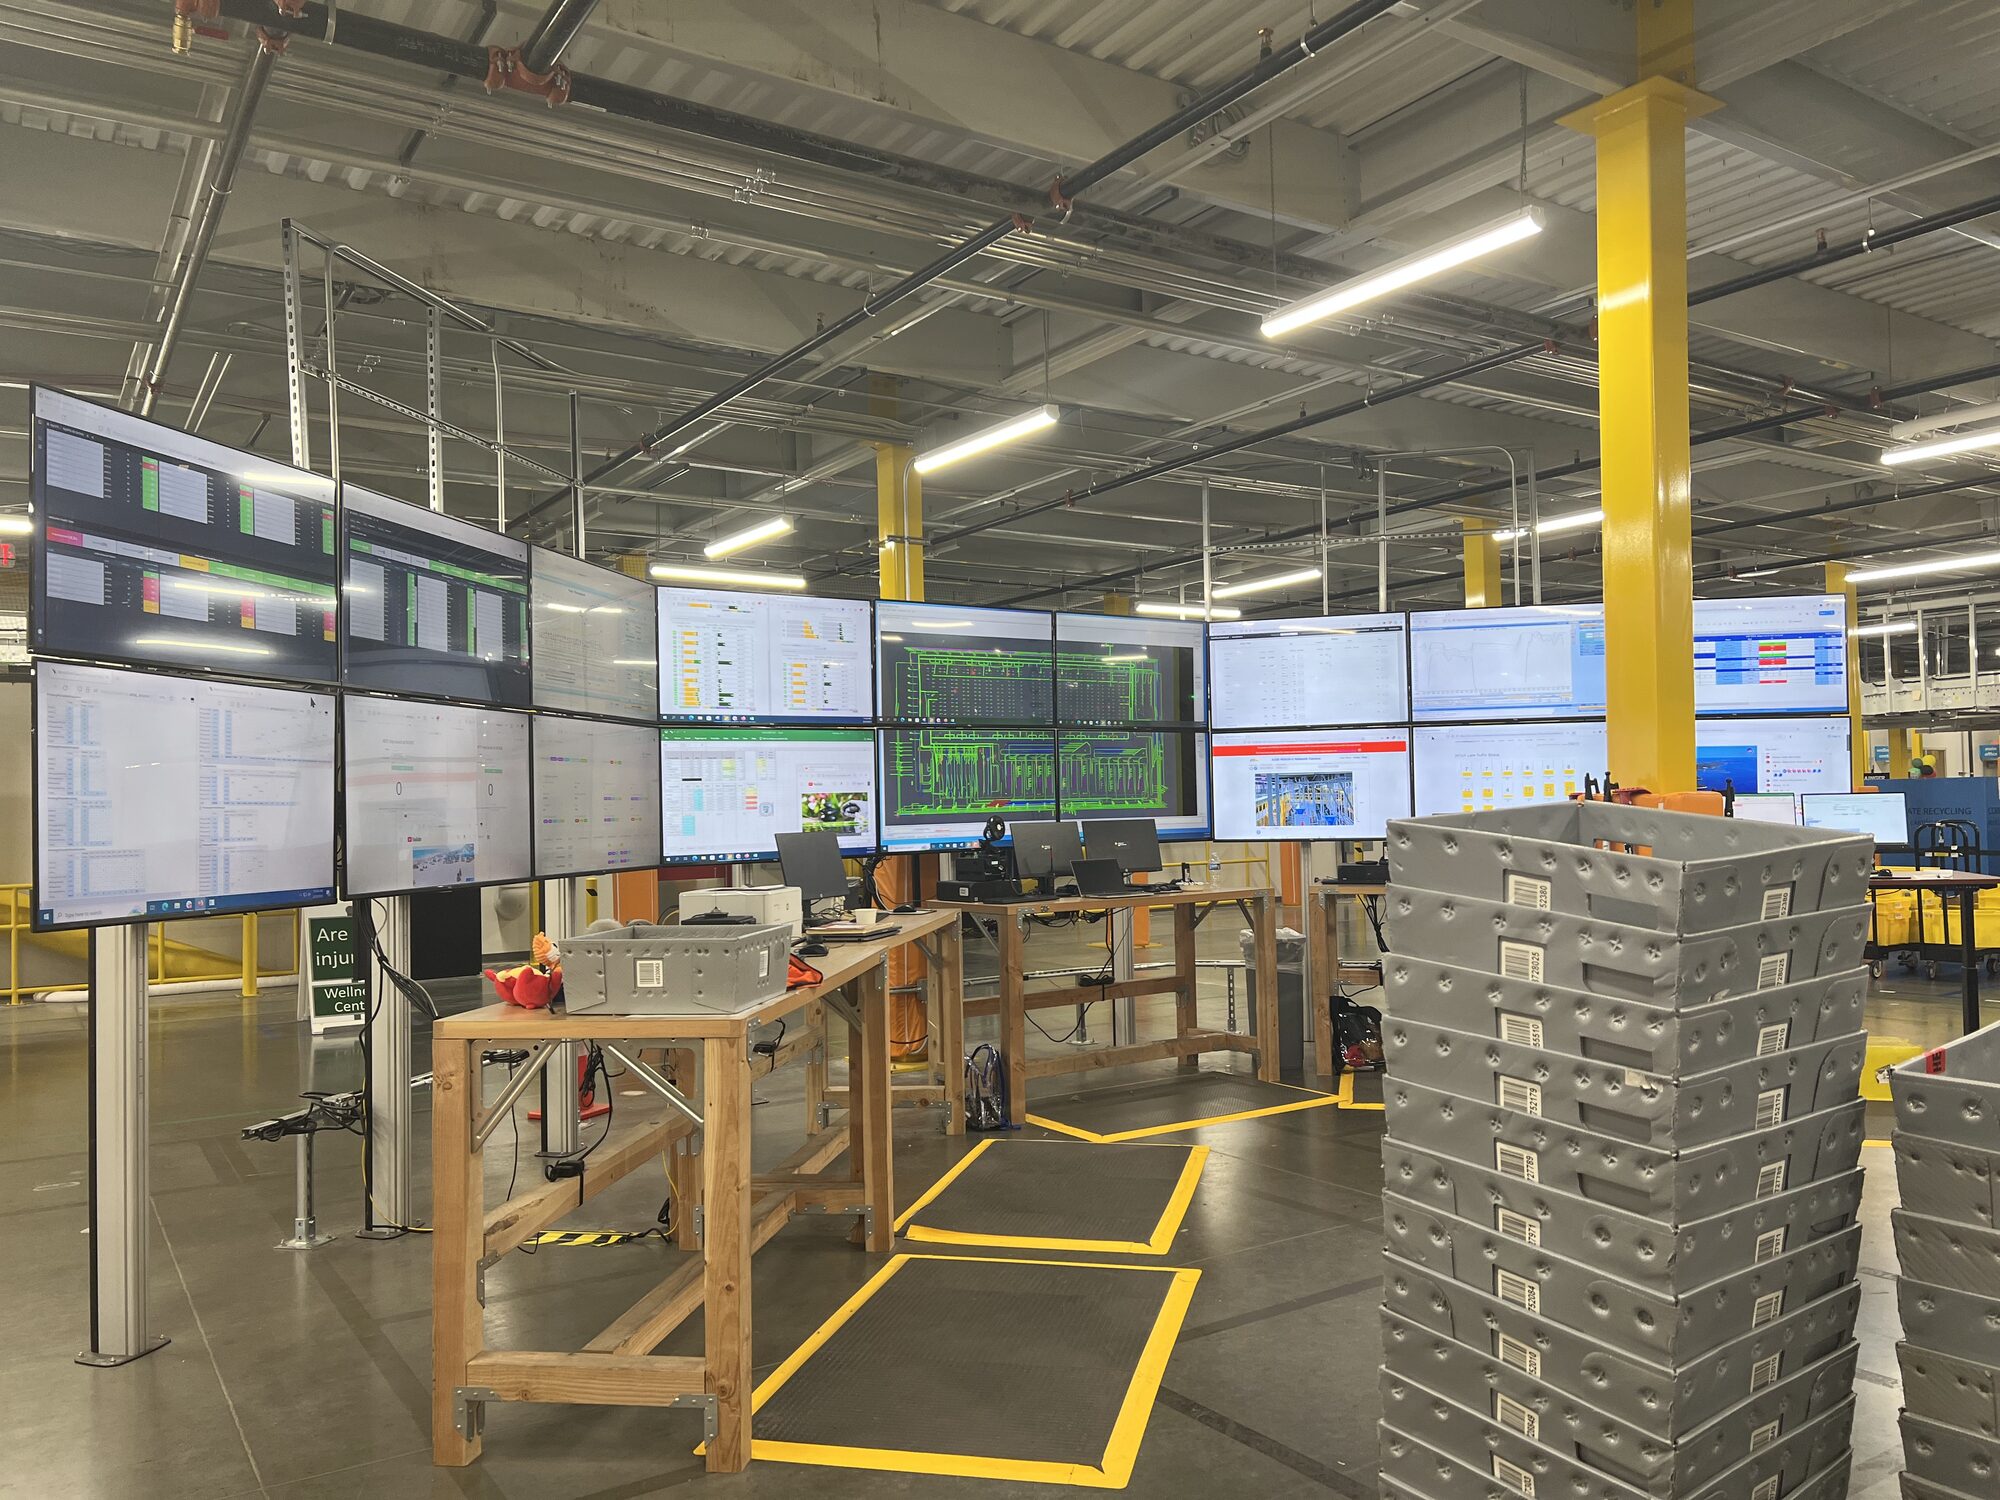
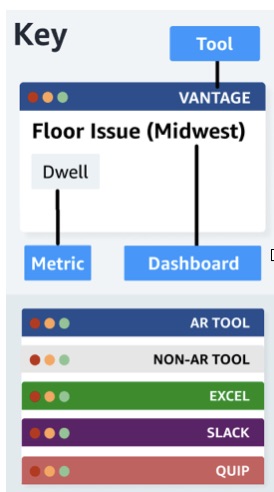
Hundreds of metrics across dozens of tools owned by Amazon Robotics, Amazon Fulfillment Technologies, and other internal orgs. Operators were the only people connecting them.

I led the UX side of a week-long ground-truth research effort at a Houston fulfillment center, cross-referenced against two additional FCs across the US, to map the full operational experience as input to a cross-org Tools North Star.

Research approach

One week onsite, three FCs in scope, every level of the org represented. The output wasn't a survey — it was a side-by-side map of which metric or data point each role pulls from which dashboard, on which screen, at which moment of the shift.

Dashboard map — AM shift: metrics and tools each operator role pulls from each dashboard page Dashboard map — OM shift: metrics and tools each operator role pulls from each dashboard page Dashboard map key — legend for the role and metric color-coding used in the maps above
Workflow map from the original research: what metric or data point each role pulls from each dashboard page, across two shifts (AM / OM) with a shared legend.

The operational hierarchy of an FC

I mapped the five-level operational structure to the actions, tools, and decision cadences each role depends on.

L8

GM / AGM

Owns the FC's KPIs, profit and loss, and network-level performance.

Assess
L7

Sr. OM

Leads a process path (Inbound, Outbound, CAP, Change Management).

Assess
L6

OM

Keeps a single process path moving — staffs, trains, and leads Area Managers.

Monitor
L4/5

Area Manager

Owns a specific area: safety, engagement, standard work.

Manage
T3

PA (Process Assistant) · QB (Quarterback) · AFM (Amnesty Floor Monitor)

Right-hand staff: SOP compliance, floor health, real-time issue resolution.

Triage

Five verbs, five cadences

Across every Ops role I mapped, daily work was made up of the same five actions — at different time horizons and through different tools. Mapping work as verbs (not job titles) let us compare tooling needs across roles — and exposed where the same task was forcing a manager to switch tools mid-flow.

01 Assess

Senior managers evaluate prior-day performance and periodic targets at shift start.

02 Monitor

Mid-level managers watch execution throughout the shift and take proactive action.

03 Manage

Managers plan staffing and adjust labor share across process paths to hit targets.

04 Triage

Support managers identify and resolve issues — staffing, equipment, engagement.

05 Communicate

Every role reports performance and issues upward, daily and per shift.

Voice of customer — in their own words

Operators told us repeatedly that the tool ecosystem is the problem, not the metrics themselves.

GM

"TELL ME WHAT TO DO — the tools should prioritize and make decisions for the building. Ops just needs to execute."

Sr. OM

"In my first month as OM, I just kept receiving links. The tools change all the time; many of my bookmarked links are out of date."

OM

"In an ideal world, when I start my shift, Vantage and Flow tools should be integrated and give me one overview of how the building is running."

AM / PA

"There are way too many tabs. Some load slowly and crash. I find myself just sitting in front of my laptop waiting."

From tool sprawl to a unified operator experience

I turned the research into a cross-organizational vision for a centralized, role-aware, decision-supporting operator tool.

Impact

The research re-shaped how Amazon Robotics planned the next generation of its operations tools.

Mapping every role, action, and tool side by side made it impossible to keep treating manager UX as a per-feature problem. The work re-positioned tools and metrics as a portfolio investment.

Start over from← Designing for Operators in High-Volume Warehouse Systems
Case 01

Get in touch

Currently exploring senior & staff-level UX roles in systems thinking and service design.